Dashboard
Your operational overview with KPIs, recent opportunities, and quick actions.
Overview
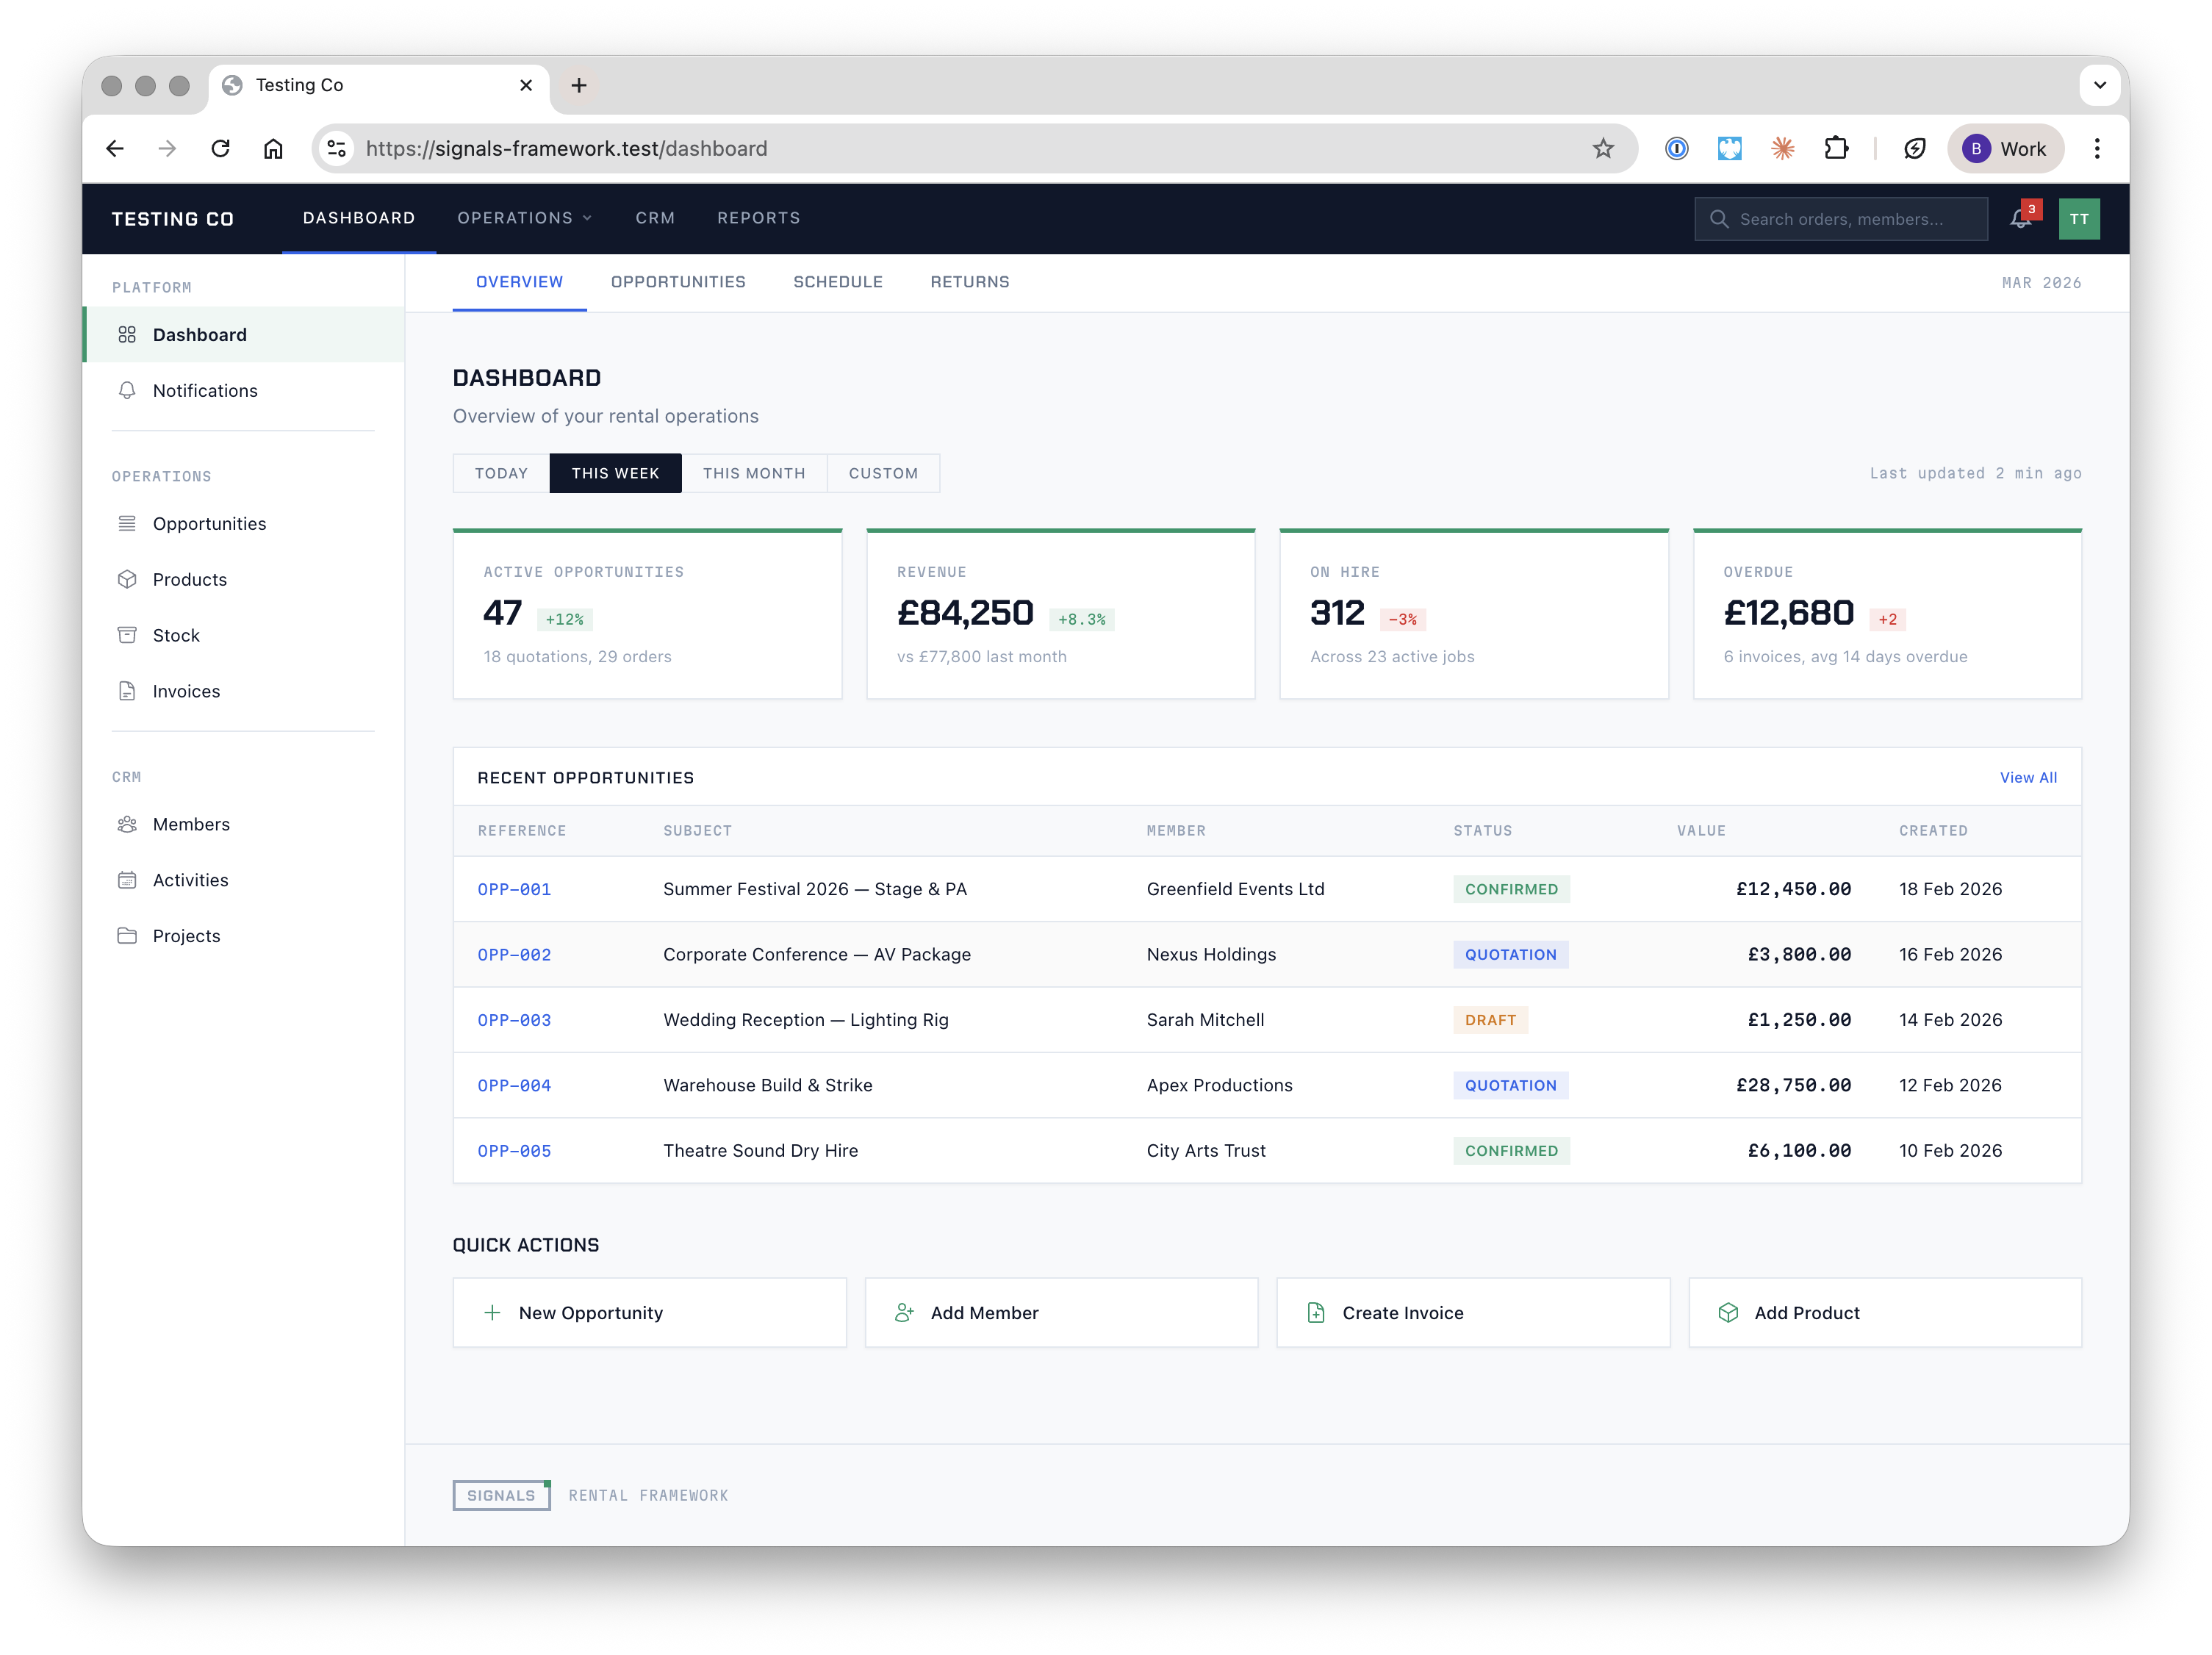
The dashboard is the first screen you see after logging in. It provides an at-a-glance summary of your rental operations — key metrics, recent activity, and shortcuts to common tasks.
KPI Cards
The top of the dashboard displays four key performance indicators for the selected time period:
| Metric | What it shows |
|---|---|
| Active Opportunities | Total open quotes and confirmed orders, with a percentage change from the previous period |
| Revenue | Total revenue for the period, compared against the previous period |
| On Hire | Number of assets currently out on hire across all active jobs |
| Overdue | Total overdue invoice value and count of overdue invoices |
Use the date range selector (Today, This Week, This Month, Custom) to adjust the reporting period. All cards update to reflect the selected range.
Recent Opportunities
A table of the most recent opportunities, showing reference number, subject, member, status, value, and creation date. Status is colour-coded:
| Status | Colour |
|---|---|
| Draft | Amber |
| Quotation | Blue |
| Confirmed | Green |
Click View All to navigate to the full opportunities list.
Quick Actions
Below the opportunities table, four shortcut buttons provide fast access to common tasks:
- New Opportunity — start a new quote or order
- Add Member — create a contact, organisation, or venue
- Create Invoice — generate a new invoice
- Add Product — add an item to the product catalogue
Dashboard Tabs
The dashboard includes sub-navigation tabs for different views:
| Tab | Purpose |
|---|---|
| Overview | KPIs, recent activity, and quick actions (default) |
| Opportunities | Pipeline and order status summary |
| Schedule | Upcoming deliveries, collections, and crew assignments |
| Returns | Assets due for return and overdue items |
Note: The dashboard is under active development. Additional widgets, customisable layouts, and real-time updates via websockets are planned.